Profitability Benchmark Calculator
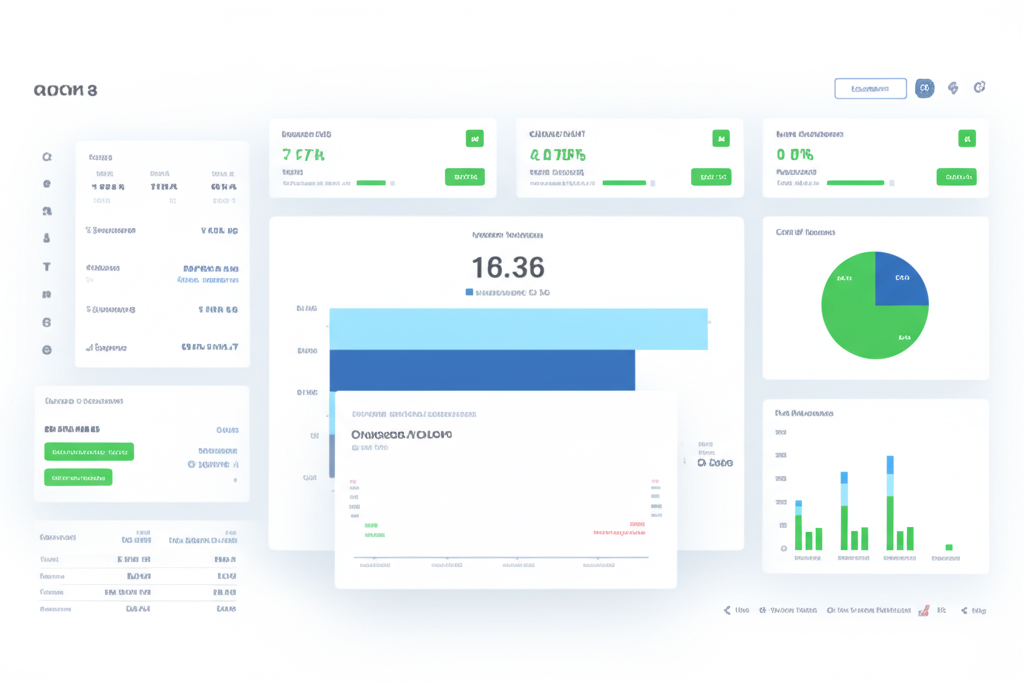
Compare your manufacturing business profitability metrics against industry benchmarks to see where you stand and identify opportunities for improvement.

How Does Your Profitability Compare?
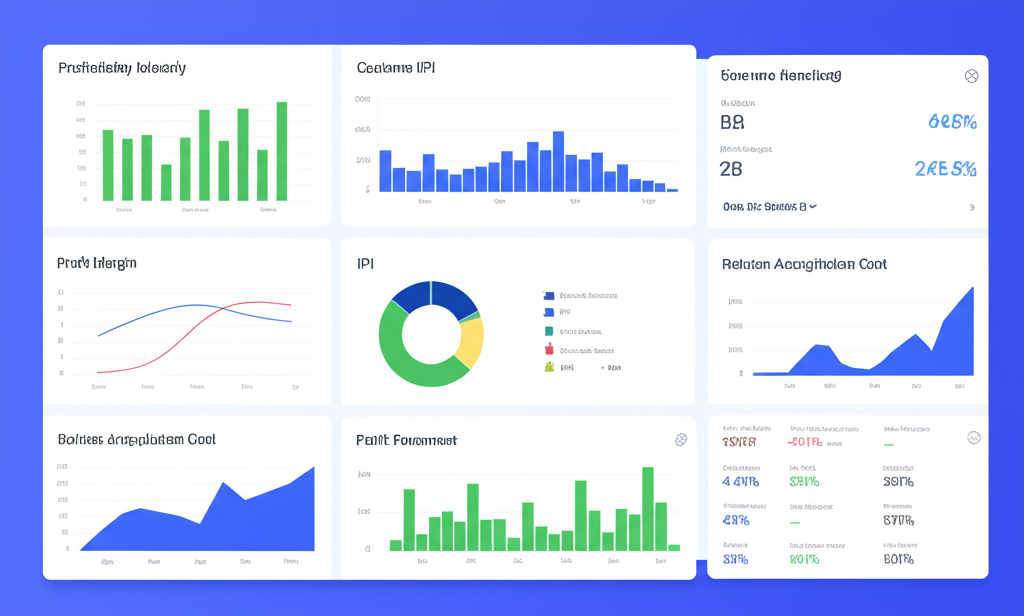
Understanding how your profitability metrics compare to industry benchmarks is crucial for identifying strengths and areas for improvement. Our calculator provides instant feedback on six key profitability metrics, helping you make informed decisions to enhance your financial performance.
All calculations are performed in your browser. Your financial data is never stored or transmitted to our servers.
Profitability Benchmark Calculator
Understanding Key Profitability Metrics
Gross Profit Margin
Measures the profitability of your core manufacturing operations by calculating the percentage of revenue that exceeds the cost of goods sold (COGS).
Operating Profit Margin
Indicates how efficiently your business manages its operations by showing the percentage of revenue that remains after covering both COGS and operating expenses.
Net Profit Margin
Reveals your bottom-line profitability by calculating the percentage of revenue that remains as profit after accounting for all expenses, including taxes and interest.
EBITDA Margin
Provides insight into your operational performance by showing earnings before interest, taxes, depreciation, and amortization as a percentage of revenue.
Return on Assets (ROA)
Measures how efficiently your business uses its assets to generate profits, calculated as net income divided by total assets.
Return on Equity (ROE)
Indicates how effectively your business generates profit from shareholders' equity, calculated as net income divided by shareholders' equity.

Interpreting Your Results
Indicates areas that need immediate attention and improvement strategies.
Your performance is on par with industry standards, but there may be room for improvement.
Your business is outperforming industry benchmarks in these areas.
Remember that benchmarks vary by industry, company size, and business model. Use these comparisons as a starting point for deeper analysis and strategic planning.
Need Help Improving Your Profitability?
Our team of manufacturing financial experts can help you analyze your results and develop strategies to enhance your profitability metrics.
Related Resources
Cost Accounting Analysis
Discover how detailed cost accounting can help identify profit improvement opportunities.
Learn more →Working Capital Solutions
Learn how optimizing working capital can improve your overall financial performance.
Learn more →