Unlocking Manufacturing Success: How Financial Benchmarking Drives Performance
Introduction: The Power of Financial Benchmarking
In today's competitive manufacturing landscape, understanding how your business performs relative to industry peers isn't just helpful—it's essential for survival and growth. Yet many manufacturing leaders operate with limited visibility into their financial performance compared to industry standards, making it difficult to identify opportunities and threats.
Financial benchmarking provides the critical context needed to evaluate your manufacturing operation's performance objectively. By comparing your key financial metrics against industry standards and top performers, you gain invaluable insights that can drive strategic decisions, operational improvements, and ultimately, increased profitability.
At Schapira CPA, we've developed a comprehensive Financial Benchmarking Dashboard specifically designed for manufacturing businesses. This powerful tool eliminates the guesswork from performance assessment and provides clear, actionable insights to drive your business forward.
Key Challenges Manufacturers Face:
- Limited access to relevant industry benchmarks
- Difficulty identifying which metrics truly matter for their specific manufacturing niche
- Uncertainty about how to interpret performance gaps
- Challenges translating benchmark insights into actionable improvement strategies
- Time-consuming manual data collection and analysis processes
Understanding Financial Benchmarking for Manufacturers
Financial benchmarking is the process of comparing your company's financial performance metrics against industry standards, competitors, or historical data. For manufacturers, this process is particularly valuable due to the capital-intensive nature of the industry and the significant impact that operational efficiency has on profitability.
The Strategic Value of Benchmarking
Identify Performance Gaps
Pinpoint specific areas where your manufacturing operation lags behind industry leaders, creating focused improvement targets.
Set Realistic Goals
Establish performance targets based on actual industry data rather than arbitrary numbers, ensuring goals are both challenging and attainable.
Validate Strategic Decisions
Use benchmark data to support or challenge strategic initiatives, capital investments, and operational changes.
Monitor Improvement Progress
Track your performance over time relative to benchmarks, providing clear evidence of the impact of improvement initiatives.
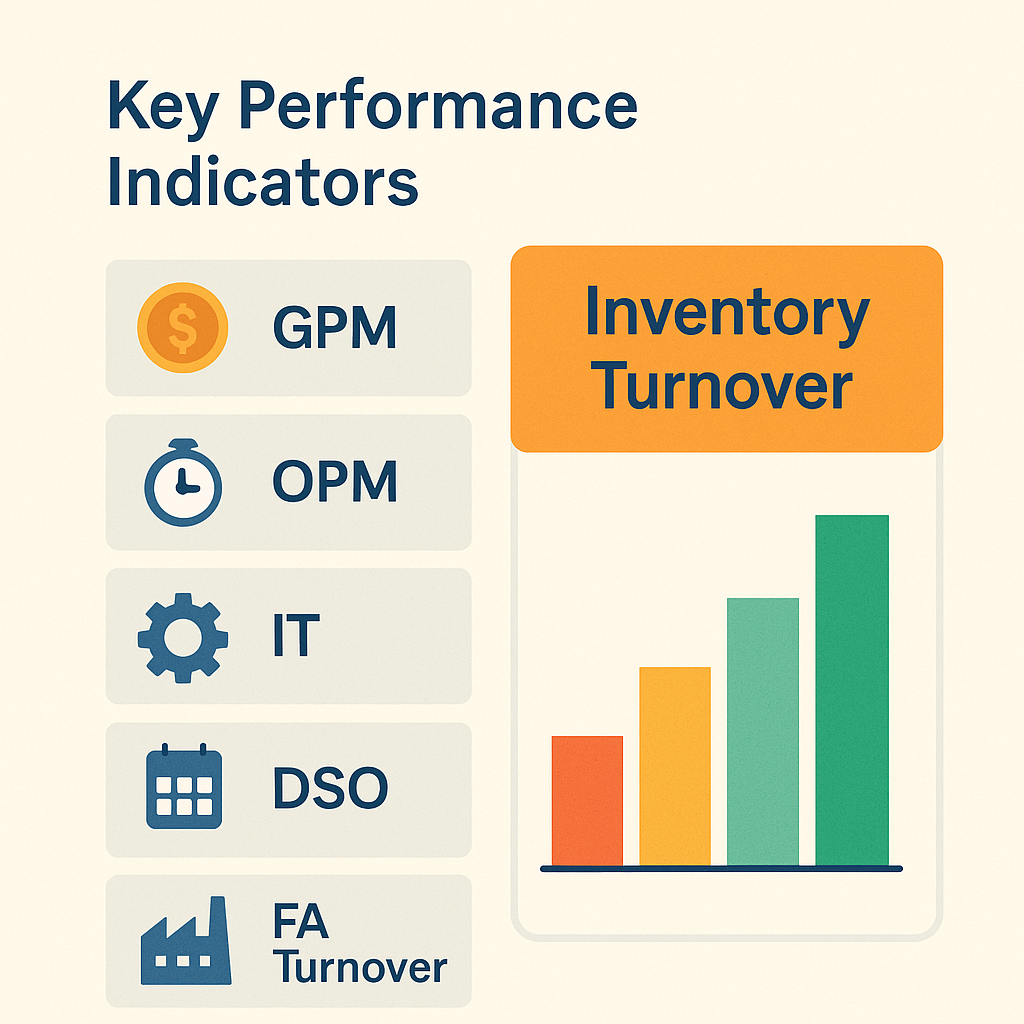
Essential Manufacturing Financial Metrics
While there are dozens of financial metrics you could track, certain key indicators are particularly relevant for manufacturing operations:
| Metric | Description | Why It Matters |
|---|---|---|
| Gross Profit Margin | (Revenue - COGS) / Revenue | Measures production efficiency and pricing strategy effectiveness |
| Operating Profit Margin | Operating Income / Revenue | Indicates overall operational efficiency |
| Inventory Turnover | COGS / Average Inventory | Shows how efficiently inventory is managed |
| Days Sales Outstanding | (Accounts Receivable / Revenue) × 365 | Reflects effectiveness of collections processes |
| Fixed Asset Turnover | Revenue / Net Fixed Assets | Measures how efficiently capital equipment is utilized |
| Return on Invested Capital | NOPAT / Invested Capital | Evaluates overall return relative to capital investment |
By tracking these metrics against industry benchmarks, manufacturing leaders can quickly identify areas of strength and opportunity, allowing for more targeted improvement efforts.
Using the Benchmarking Dashboard: A Step-by-Step Guide
Our Manufacturing Financial Benchmarking Dashboard simplifies the process of comparing your performance against industry standards. Here's how to get the most value from this powerful tool:
Enter Your Company Information
Begin by providing basic information about your manufacturing business, including company name, industry sub-sector, annual revenue, and number of employees. This information helps the dashboard select the most relevant peer group for comparison.
Input Your Financial Metrics
Enter your key financial data points from your income statement, balance sheet, and cash flow statement. The dashboard provides clear guidance on where to find each metric in your financial statements.
Customize Your Peer Group
Refine your comparison group by selecting specific criteria such as revenue range, geographic region, and company age. This ensures you're comparing your business against truly relevant peers.
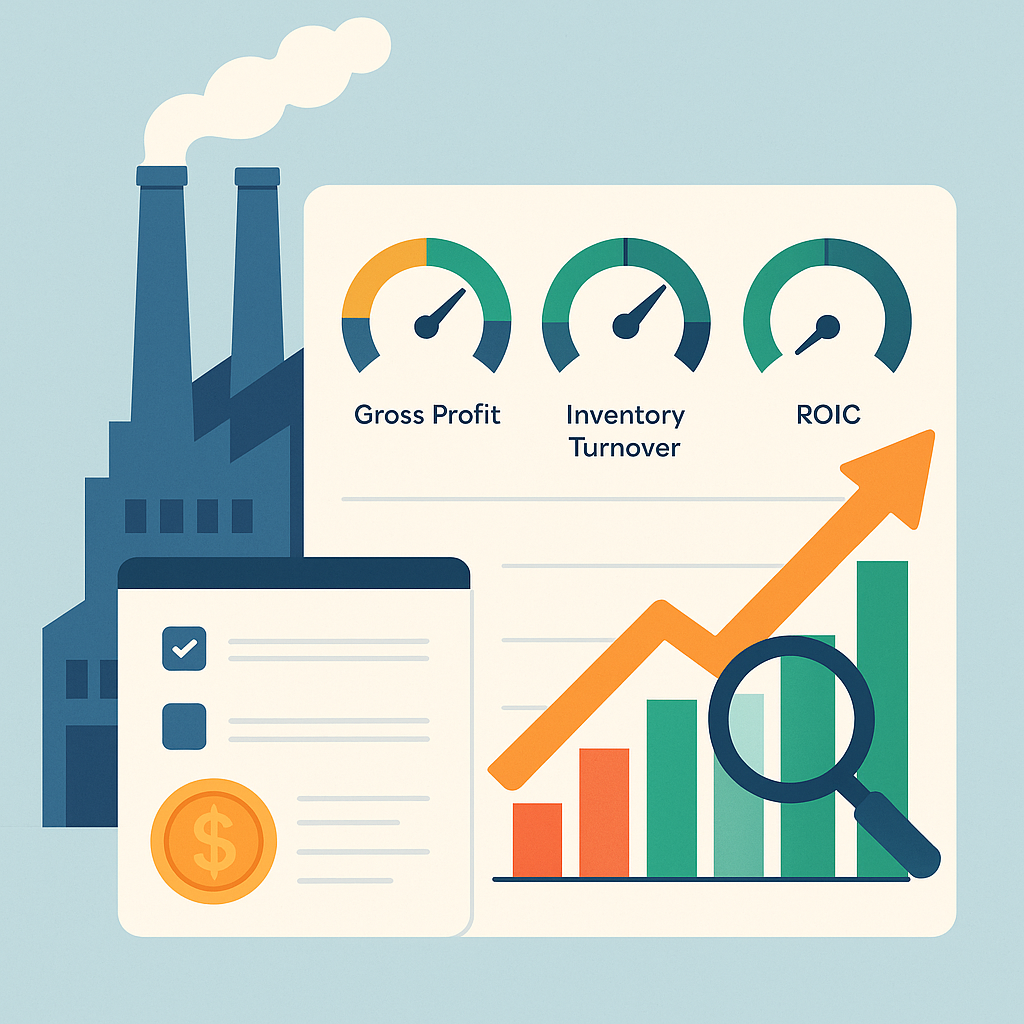
Review Your Performance Dashboard
Examine the visual representation of your performance across key metrics. The dashboard uses intuitive gauge charts and color-coding to highlight areas where you excel (green), perform adequately (yellow), or need improvement (red).
Analyze Performance Gaps
Dive deeper into areas where your performance deviates significantly from industry benchmarks. The gap analysis tool quantifies the financial impact of each performance gap and suggests potential improvement strategies.
Generate and Share Reports
Create comprehensive benchmark reports that can be downloaded, printed, or shared with your management team, board, or financial advisors. These reports provide a clear snapshot of your current performance and highlight priority improvement areas.
Pro Tip: Benchmarking Best Practices
- Perform benchmarking quarterly to track progress and identify emerging trends
- Include both financial and operational metrics for a complete performance picture
- Compare against both industry averages and top performers (75th percentile)
- Use benchmark insights to set specific, measurable improvement goals
- Share benchmark results with your team to drive accountability and engagement
Key Financial Metrics: Deeper Insights
Let's explore a few critical manufacturing financial metrics in greater detail, including how to interpret them and strategies for improvement:
Gross Profit Margin
What it reveals: Your gross profit margin directly reflects the efficiency of your production processes and the effectiveness of your pricing strategy. A margin significantly below industry benchmarks may indicate issues with production efficiency, material costs, labor productivity, or pricing power.
Improvement Strategies:
- Implement lean manufacturing principles to reduce waste and improve efficiency
- Negotiate better terms with suppliers or explore alternative materials
- Analyze product mix to focus on higher-margin items
- Review pricing strategy and consider value-based pricing approaches
- Invest in automation for repetitive, labor-intensive processes
"After benchmarking revealed our gross margin was 4.2% below industry average, we implemented targeted efficiency improvements in our production line. Within six months, we closed the gap and added $380,000 to our bottom line."
— Operations Director, Precision Metal Products Manufacturer
Inventory Turnover
What it reveals: This metric shows how efficiently you're managing inventory levels relative to sales. Low turnover compared to benchmarks suggests excess inventory, which ties up working capital and increases carrying costs. Extremely high turnover might indicate stockouts and potential lost sales.
Improvement Strategies:
- Implement just-in-time inventory management where appropriate
- Use ABC analysis to prioritize inventory control efforts
- Improve demand forecasting accuracy
- Establish vendor-managed inventory arrangements with key suppliers
- Identify and liquidate obsolete or slow-moving inventory
"Benchmarking showed our inventory turnover was half the industry average. By implementing improved forecasting and JIT principles, we increased turnover by 70% and freed up over $1.2M in working capital."
— CFO, Industrial Equipment Manufacturer
Return on Invested Capital (ROIC)
What it reveals: ROIC measures how effectively your manufacturing business generates returns relative to the capital invested. This comprehensive metric accounts for both operational efficiency and capital allocation decisions. A below-benchmark ROIC suggests either operational inefficiencies or suboptimal capital deployment.
Improvement Strategies:
- Divest underperforming assets or product lines
- Implement more rigorous capital expenditure evaluation processes
- Focus on improving asset utilization through better scheduling
- Consider asset-light approaches where appropriate (e.g., outsourcing non-core processes)
- Optimize working capital management
"Our benchmarking analysis revealed our ROIC was 3.8 percentage points below industry leaders. By implementing a comprehensive capital optimization program, we improved ROIC by 5.2 percentage points over 18 months."
— CEO, Automotive Components Manufacturer
Real-World Success Stories: Benchmarking in Action
Case Study: Mid-Size Metal Fabricator
Challenge:
A metal fabrication company with $18M in annual revenue was experiencing declining profitability despite stable sales. Management suspected inefficiencies but lacked visibility into specific problem areas.
Benchmarking Approach:
Using our benchmarking dashboard, the company compared their performance across 15 key financial metrics against similar-sized metal fabricators. The analysis revealed that while most metrics were near industry averages, their Days Payable Outstanding was 22 days shorter than the industry benchmark, and their SG&A expenses were 3.2 percentage points higher than top-performing peers.
Actions Taken:
- Renegotiated payment terms with key suppliers to extend DPO
- Implemented a targeted SG&A reduction program
- Established quarterly benchmarking reviews to monitor progress
Results:
Within 12 months, the company extended DPO by 15 days, improving cash flow by approximately $740,000. SG&A expenses were reduced by 2.1 percentage points, adding $378,000 to the bottom line. Overall operating profit margin improved from 4.8% to 7.3%.
Case Study: Custom Plastic Products Manufacturer
Challenge:
A custom plastic products manufacturer with $7M in revenue was considering a significant capital investment in new equipment but was uncertain if the investment was justified given their current performance.
Benchmarking Approach:
The company used our benchmarking dashboard to compare their asset utilization, productivity, and return metrics against industry peers. The analysis revealed their Fixed Asset Turnover was 1.8x compared to the industry average of 2.7x, indicating significant underutilization of existing equipment.
Actions Taken:
- Postponed new equipment purchases
- Implemented improved production scheduling to maximize equipment utilization
- Introduced preventive maintenance program to reduce downtime
- Provided operator training to improve efficiency
Results:
Within nine months, Fixed Asset Turnover improved to 2.5x, nearly matching the industry benchmark. Production capacity increased by 28% without additional capital investment, and ROIC improved from 11.2% to 16.8%.
Conclusion: Transform Your Manufacturing Business Through Benchmarking
Financial benchmarking is not merely a diagnostic tool—it's a catalyst for strategic transformation in manufacturing businesses. By providing objective performance context and highlighting specific improvement opportunities, benchmarking enables more informed decision-making and targeted improvement efforts.
Our Manufacturing Financial Benchmarking Dashboard simplifies what was once a complex, time-consuming process, making powerful performance insights accessible to manufacturing businesses of all sizes. By regularly comparing your performance against industry benchmarks, you can:
- Identify and prioritize your most significant improvement opportunities
- Set realistic, data-driven performance targets
- Make more confident strategic and capital allocation decisions
- Track your progress toward industry-leading performance
- Build a culture of continuous improvement based on objective metrics
In today's competitive manufacturing environment, companies that leverage data-driven insights gain a significant advantage. Don't let your manufacturing business operate in a performance vacuum—use benchmarking to illuminate your path to improved profitability and sustainable growth.
Ready to Benchmark Your Manufacturing Business?
Gain valuable insights into your financial performance and discover specific opportunities to improve profitability with our comprehensive benchmarking dashboard.
About Schapira CPA: We specialize in providing financial advisory services to manufacturing businesses, helping them optimize performance, reduce tax burden, and achieve sustainable growth. Our team combines deep industry expertise with cutting-edge analytical tools to deliver actionable insights and measurable results.
Related Resources
Financial Ratio Calculator
Calculate and analyze key financial ratios for your manufacturing business to complement your benchmarking analysis.
Try the calculatorManufacturing Business Valuation
Determine the value of your manufacturing business using our comprehensive valuation calculator.
Value your business